Distributed tracing and Real Time Application Monitoring is an essential component of any modern software architecture. This is done through telemetry, meaning produce some kind of tracing data about the software (included but not limited to logging) and transmit it to some external system to be stored and processed.
Telemetry monitoring combined with tracing helps develops to find out about application issues, even before users start to complain about them. Specially in case of microservice architecture Distributed Tracing reveals the performance related asa well as other issues. This way you can maximize the availability and performance of your applications and services.
Application Insights
Application Insights is an Azure service that is a part of Azure Monitor. The Application Insights SDK for NodeJS is available as a npm package. Using this library you can communicate your telemetry data (including your application logs) to azure cloud. This SDK also comes with an inbuilt Distributed Tracing capability.
Telemetry data ends up in a Log Analytics workspace on your azure cloud subscription and it is accessible through the Azure Application Insights via azure portal. You can monitor and analyze your your data and create alerts. Application Insights also takes care of the data rotation, so do not need to delete/archive old data manually.
Note that you do not necessarily need to host your application on Azure Cloud infrastructure to benefit azure application insights; you can host your application anywhere like AWS, Google cloud, and even on your own premises, and yet utilize the Azure Application Insights. All you need on Azure cloud is the required resources for the Application Insights.
To enable the Application Insights on your Node.js project please add the Application Insights Node.js SDK to your app by running this command:
npm i applicationinsightsIn case of TypeScript please also make sure that @types/node is installed (read also How to setup a TypeScript project dev environments like a pro).
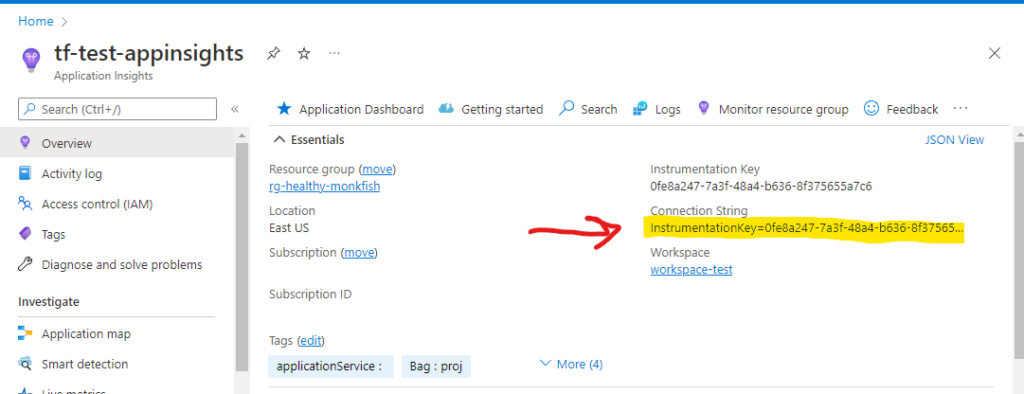
All you need, to connect your Application Insight to your NodeJS application, is a connection string. You can find it in your overview section of your application insights on your azure portal as shown on image below (create one?):
To setup the azure Application Insights work and send telemetry of your application to azure, you need to use this library only one time at starting point of your nodejs application (index.ts/js) and NOT any of the internal modules/functions. The basic usage with enabled logs enabled is:
let appInsights = require("applicationinsights");
appInsights.setup("<YOUR_CONNECTION_STRING>")
  .setAutoCollectConsole(true, true)
.start();setAutoCollectConsole: is where you tell your Application Insights to log your your logger tracking. The default behavior of the this property is to exclude calls to console.log (and other console methods). By passing a true as the second argument we configure Application Insights to include calls to console methods.
Logging best practices NodeJS
One of the dilemmas developers often face is where to put logs in between their code lines. There are some people overdoing it and people that totally neglect it. When it comes to logging, we should ask ourselves why are we logging and what is the use case of your logs.
Here are some of the things you should keep in mind when you are logging your application:
1- Think about monitoring and log rotation
When you are logging, it is important to think about how you are going to access these data; is there a service in place to alert you when something goes wrong (for example your app generates error 2 times within 5 minutes time)? Is there any good searching tool to find logs you are looking for? Can you make a dashboard of the logs and other data? How about when your logs are old, is there a tool to automatically archive/delete the old data?
On the other hand, when are working on a distributed system or microservices the logs should be gathered and centralized for your monitoring system to work effectively. You also need a Distributed Tracing where interactions are uniquely tagged.
All above is easily achievable with Azure Application Insights.
2- Use the Correct Log severity level
An informational trace is not as important as an error; whenever an error happen in you system, someone, or some automation should react to it while informational traces are probably a very common type of trace and can happen in many different cases. Here are the severity levels according to azure insights:
| Critical | 4 | Critical severity level. |
| Error | 3 | Error severity level. |
| Warning | 2 | Warning severity level. |
| Information | 1 | Information severity level. |
| Verbose | 0 | Verbose severity level. |
When you are using Application Insights you have basically two options for logging tools:
Option 1 :NodeJs Application Insights: use native console
console module in NodeJS is similar to the JavaScript console in browsers, it has methods such as console.log(), console.error(), and console.warn() and Application Insights (provided that you set it up for the task) is going to pick these up and assign a severity either 1 or 2 to the console methods.
Console methods are simple and everyone understands them, and as a plus you don’t need to reference them. It is can be a right tool for the right job. There is no shame using them in a very small project.
You can use console.log and allay method as console.log([data][, ...args]). This way you can pass information to the message as with arguments:
const methodName = "My method";
const count = 10;

console.log("Function %s is called %d times ", methodName , count);
/// outputs: Function My method is called 10 times
Here are some useful patterns :
- %s for a String
- %d or %i for Number
- %f for Floating points
- %o for an Object
- %j for an JSON
Here is an example how you use your application insight with console methods in Node.js :
let appInsights = require("applicationinsights");
appInsights.setup("<YOUR_CONNECTION_STRING>")
    .setAutoCollectConsole(true, true) // the second true argument enables tracing the console methods
    .start();

const methodName = "My method";
const count = 10;
console.log("Function %s is called %d times ", methodName, count); // severity level: 1
console.info("Here is a sample info"); // severity level: 1
console.warn("Here is a sample warn"); //severity level: 2
console.error("Here is a sample error"); //severity level: 2
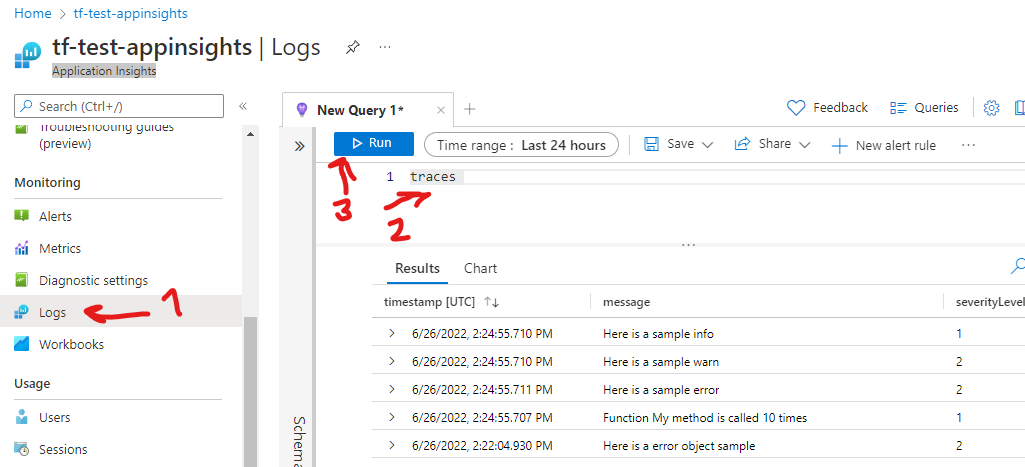
Since the assigned severity is either 1 or 2 out of the box, if there is no other reason, you can stick to using console.log and console.error . Here is what you see in Application Insights portal as result of running above code. As you notice the timestamp is added automatically so you don’t need to be worried about that.
Even when you are using console methods, I strongly suggest to create a wrapper around it and call methods through that wrapper. You never know, maybe in future you decide to change your logger and it is a good practice to decuple from direct dependency to console methods.
Option 2 :NodeJs Application Insights, use third-party loggers
For any kind of project bigger than “very small” this is the way to go. There are a handful of good third-party loggers and Application Insights recognizes some of them by default. By far, the most popular logging library is Winston. Here how you set Winston simply to send your logs to your app insights:
First install the library
npm i winstonHere is a typescript and ECMAScript sample , for CommonJS use require instead of import.
-application
|-------------- logger.js
|-------------- call-logs-sample.js
|-------------- index.js
Lets create a logger.js or .ts
import { createLogger, transports, format } from "winston";

const loggingLevels = {
    emerg: 0,
    alert: 1,
    crit: 2,
    error: 3,
    warning: 4,
    notice: 5,
    info: 6,
    debug: 7
}

const logger = createLogger({
    levels: loggingLevels,
    level: 'debug',
    format: format.json(),
    transports: [new transports.Console()],
});

export default logger;
Line 3 : Application Insights, out of the box does not recognize severity of severity of npm log logging system, though the RFC 5424 standard seems to be recognized. Fortunately winston also recognizes RFC 5424, you just need to define the levels and pass to it,
Just to demonstrate how to logs inside your modules/ functions, let’s make a module (or inside function that uses our logger) call-logs-sample.js or .ts :
import logger from "./logger";

export default function callLogsSample() {
    // rest of your code
    logger.emerg('emerg');
    logger.alert('alert');
    logger.crit('crit');
    logger.error('error');
    logger.warning("warning");
    logger.notice("notice")
    logger.info('info');
    logger.debug('debug');

}
Lastly let’s create our exportable index.js or .ts (with that is exporting our main)
import * as appInsights from "applicationinsights";
import callLogsSample from "./call-logs-sample";

export async function main() {
    //set it up only once in your main
    appInsights.setup("<YOUR_CONNECTION_STRING>")
        .setAutoCollectConsole(true, false)
        .start();

    //use logger in your inside modules/functions as normal
    callLogsSample();
}

main();
Line 7 : as mentioned when you use an external library you can set to ignore the console.log, to do that this set the second argument as false.
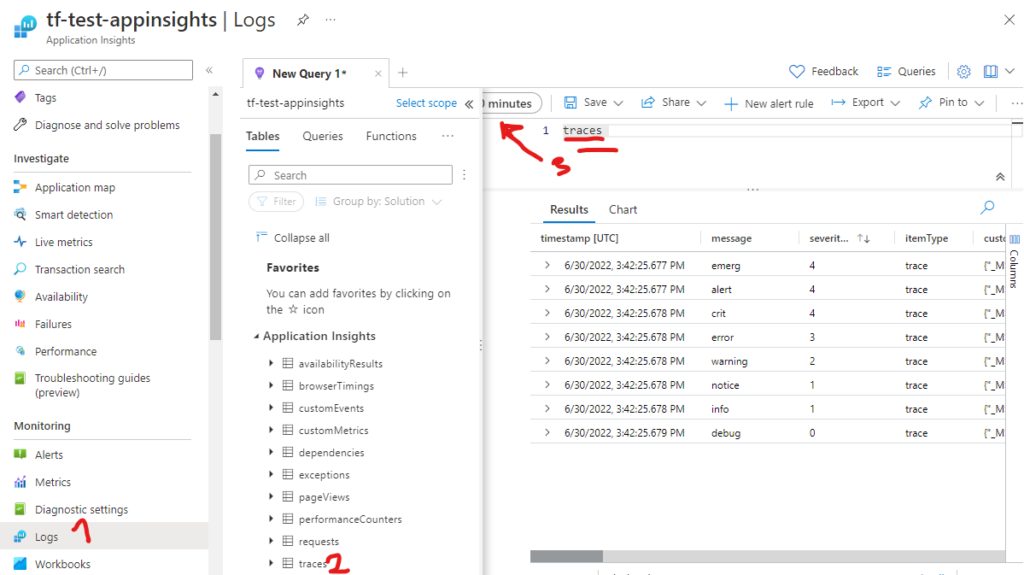
Image below shows the logs send to app insights:
3- Log in both for human and machine
Although logs are really useful for humans to read while troubleshooting, there are many cases that logs can be used by an automated system to analyze and act on it. Also to create a monitoring dashboard for purposes like auditing, profiling, statistics.
use json format :
Json is easy for humans to read, It is easy for machines to parse and generate. When you are using external libraries, they help you to format your log as json. It is especially beneficial if you push also your logs to other systems than Application Insights (like a storage); this way you can put severity and timesteps outside the main message body. This makes your logs more readable a to humans and more parse-able to machines.
4- Keep your logs concise, but informative and meaningful
Keep it short
Reading logs is hard by itself, a lot of irrelevant information in the body of the message just makes it harder. Keep the body of message as short as possible. Think why you are producing this information, and only add information you find really useful.
Make it informative
A message like “oops, something went wrong” is short but only good as a UI message to user (for security reasons while hiding what when wrong), but when you are logging you should definitely say what went wrong, and to some extent why. A better message would be “Saving new user failed while creating user on checkout: unable to write to database. Retried 5 times” and also put the database error massage as the inner message.
Keep the sensitive information out of logs
This one is kind of obvious but it still worth mentioning. Do not reveal any sensitive information with your logs. Maybe it helps to troubleshoot the database that failed faster if you mention the connection string in the log, but the risk is too high; You never know who can read your logs and where they end up!
5- Use middleware for logging when processing requests
When dealing with express make a use of middleware to log instead of creating log for each event.
An Express middleware is a function that has 3 arguments (req, res, next). All you need to do is when you are done with your function call next(); so the middleware can trigger the next in the pipe (line 8 below).
Using the middleware you can create log for all the requests without repeating yourself. To add your middleware call the use method of the express app (line 10 below)
import logger from "./logger";
import express from 'express';
const app = express();

//Middleware
const loggerMiddleware = (req: express.Request, res: express.Response, next: express.NextFunction) => {
    logger.info(`sample info logger  ${req.url}`);
    next();
}
app.use(loggerMiddleware);

//Sample Express get handler
app.get('/', (req, res) => {
    let responseText = 'Hello World!'
    res.send(responseText);
})
app.listen(3000);
Application Insights log uncouth errors and other time of info
More telemetry options with Application Insights
If decided to use App Insights, there more useful information you can gather. Out of the box you get collection of HTTP requests, popular third-party library events, unhandled exceptions, and system metrics. But you have total control over what data to send to Application Insights. See the snipt below it is self describing:
let appInsights = require("applicationinsights");

appInsights.setup("<connection_string>")
    .setAutoDependencyCorrelation(true)
    .setAutoCollectRequests(true)
    .setAutoCollectPerformance(true, true)
    .setAutoCollectExceptions(true)
    .setAutoCollectDependencies(true)
    .setAutoCollectConsole(true)
    .setUseDiskRetryCaching(true)
    .setSendLiveMetrics(false)
    .setDistributedTracingMode(appInsights.DistributedTracingModes.AI_AND_W3C);

    appInsights.defaultClient.config.samplingPercentage = 10;

    appInsights.start();
Line #12 : Distributed tracing is a method of observing requests as they spread and communicate through distributed cloud environments. Interaction are tagged with a unique identifier that stays with the transaction as it interacts with microservices, containers, and infrastructure. AI_AND_W3C enables W3C distributed tracing for backward compatibility.
Line #14 : include this line if you want to sent less than 100% of the time telemetry information. This is useful when you have too much telemetry data and you want to communicate a portion of data to azure insights.
Leave a Reply